
Are Vegas’s NBA spreads accurate?
Introduction: What are NBA spreads?
When sports betting was legalized this summer, it sparked a debate amongst my friends about whether Vegas is accurate in setting spreads over the course of a season across the NBA (or if there’s a bias that we could theoretically exploit to `beat the house.’)
The Python code I wrote to pull, scrub and analyze the data is available on GitHub as a Jupyter notebook
In addition to taking bets on whether a team will win or lose straight up, Vegas also offers a `spread’ that handicaps the favored team. Vegas wants to set the point spreads so that the chance of a team winning or losing is 50-50. This incentivizes an equal number of bets on both sides of the bet and allows Vegas to make money every time directly from commissions. Therefore if Vegas is accurate, on average every team would win 50% of the time against the spread.
Results: Are Vegas’s NBA spreads accurate?
With data on the on the win-loss records against the spread for the 2017-2018 NBA season, we can calculate how far each team was from 0.500 win record against the spread and investigate the variation in this data. The Python code I wrote to pull, scrub and analyze the data is available on GitHub as a Jupyter notebook
Here’s what the win-loss records against the spread and straight up look like for the 2017-2018 NBA season:
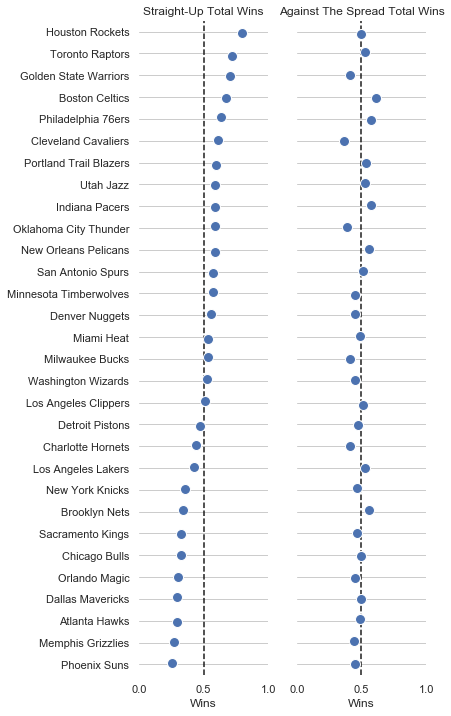
Above is the fraction of total wins straight up and against the spread for all 30 teams in the NBA. If Vegas were perfectly accurate, every team would have a 50% win record (against the spread) and there wouldn’t be any variation around 0.5 on the second dot plot. Here’s a distribution of how far each team was from a 0.500 win record.
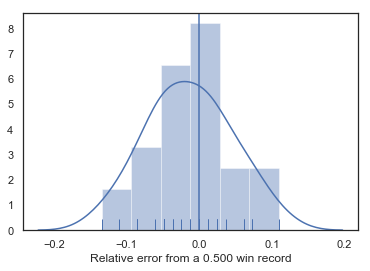
Based on this distribution of data, the average deviation from a 0.500 record (against the spread) for the 2017-2018 NBA season was -0.013. Vegas therefore tended to set the lines slightly too high but we want to test whether this is statistically significant.
Rather than make any assumptions about how the deviations from 0.500 are distributed, we calculate an empirical bootstrap confidence interval.
To learn more about about the empirical bootstrap and how and why it is calculated, see sections 6.3 and 6.4 of MIT OpenCourseware’s Intro to Probability and Statistics (18.05) class notes from session 24. The 95 percent confidence interval will correspond to a range of values that are not rejected at a 0.05 significance level. To learn more about the relationship between confidence intervals and hypothesis testing see section 4 from MIT OpenCourseware’s Intro to Probability and Statistics (18.05) class notes from session 23a.
Therefore, if 0 fall within the 95 percent confidence interval we would conclude that Vegas is on average accurate and if 0 falls outside of the 95 percent confidence interval we would conclude that Vegas is on average inaccurate. After estimating the distribution of how much the sample mean varies around an underlying population mean, we find that the 95 percent confidence interval is [-0.034, 0.006]. Since this range contains 0, we would conclude that Vegas is on average accurate.
Methods: Notes on using statistics and Python to perform this analysis
To learn more about about the empirical bootstrap and how and why it is calculated, see sections 6.3 and 6.4 of MIT OpenCourseware’s Intro to Probability and Statistics (18.05) class notes from session 24.
To learn more about the relationship between confidence intervals and hypothesis testing see section 4 from MIT OpenCourseware’s Intro to Probability and Statistics (18.05) class notes from session 23a.
I found these resources helpful for getting started with and using Python to perform this analysis: